R's Demise is Highly Overblown
In this post I will provide evidence that contradicts recent reports that the R Programming language is declining in popularity.
In last few months I have come across several blog posts that suggest that Python is reducing the demand for R. Yet, it contradicts what I am seeing in my day to day life. Many analyst at work from different parts of the business that are not associated with data science or software engineering are adopting the R programming language because it feels more comfortable than Python and they are not interested in building software or building production pipelines. These souls are highly ignored by the software community, but they are embraced by the R community because at the end of the day we just care about the data and the stories that they tell, and R is great for telling stories.
Introduction
As I have read all these posts about Python impacting the demand for R and implying that R was on the decline, I thought about how I could address this question empirically. I thought to myself, if the rise in Python for data science is decreasing the demand for R for data science, then naturally, you would see a decrease in R downloads as users moved from R to Python. Therefore, my experiment is designed below:
Design of Experiment:
Null Hypothesis (H0): No measurable impact to R downloads, given the rise in Python.
Alternative Hypothesis (H1): R downloads decline, given the rise in Python.
Basic Assumption: R downloads are conducted by users intending to use the language. In other words, users are not downloading R just because they enjoy downloading stuff; they actually intend to use the download.
The Data
Ideally, I would collect the number of times R is download from the CRAN mirrors, as well as, collect the number of times Python is downloaded over time. My thought was to start the analysis from 2015 because it would give me 260 weeks of data, and because this a time period that Python has been on the rise. From this point, you can conduct Granger Causality Test to see if Python is truly impacting the demand for R. Unfortunately, I was not able to find a downloadable count of Python downloads since 2015. I did find a page that provide the last 30 days of download statistics, but nothing that you can download that was relevant to this exercise.
R fared a little better but not much. CRAN has dozens of mirrors around the world that are self hosted. In other words, unless the mirror owners publish there download history, there is no way to know how many times R is being downloaded. Luckily, RStudio has provided a way to obtain the downloads of R from their mirror with the R package cranlogs.
The cranlogs package not only gives you downloads for R itself, but also for packages that are downloaded from the RStudio cran mirror. Because RStudio has an easy GUI interface for downloading packages, and is extremely popular among R users, I will assume that a majority of the package downloads are downloaded by users using RStudio IDE from this cran mirror.
In contrast, I will not make the same assumption about installing R itself. Normally, I install R core from the https://www.r-project.org/ website and then I install RStudio IDE. This is important because I will use the RStudio R downloads as a proxy for all R downloads worldwide. In other words, the total for R downloads in this analysis is only a subset of all R downloads. I make this assumption because the way you download R is subjective based on your prior experience.
There will be 3 sets of data that I will be working with for this analysis. First is the data from the cranlogs discussed above. Second, I will use data from the rversions package in order to get R version release dates. The version dates data will be used to label the graphs and to understand some of the behavior in the downloads. The third data set that will use comes from the gtrends package. I will use this data as a proxy for what the is being observed by the TOIBE Index and the PYPL Index, creators of web search trend indexes. Finally, I research some dates that I felt were relevant after analyzing the data. For example, Hadley Wickham’s introduction of the Tidyverse at the useR! 2016 conference at the end of June 2016.
Analysis
To begin my analysis, I will use the packages loaded below.
# Libraries
library(cranlogs)
library(lubridate)
library(gridExtra)
library(tidyverse)
library(tsibble)
library(gtrendsR)
library(rversions)
library(scales)
library(kableExtra)
library(plotly)

# Options
options(scipen = 999)

# Important Dates
hadley_tidyverse <- as.Date('2016-06-26')
tidy_searches_beg <- as.Date('2016-07-31')
tidyvere_release_1_0 <- as.Date('2016-09-15')
Here is a quick look at the download data from the cranlogs package. I created some new features, date factors and period dummy variables, in order to drill into the data graphically. (NOTE: download data excludes the last 3 days of 2019, so no data for 29th - 31st, 2019.)
| date | version.x | os | count | os_factor | ver_factor | ver_lvl | ver_lvl_factor | ver_lvl_top | ver_lvl_top_factor | year | month | week | yr_mo | yr_wk | ver_3_5_f | version.y | vers_i | nickname | greg_d | |
|---|---|---|---|---|---|---|---|---|---|---|---|---|---|---|---|---|---|---|---|---|
| 76036 | 2019-12-29 | 2.10.0 | osx | 2 | osx | 2.10.0 | 210 | 210 | 2 | 2 | 2019 | 12 | 52 | 2019 Dec | 2019-12-23 | 1 | NA | NA | NA | NA |
| 76037 | 2019-12-29 | 3.6.1 | win | 6 | win | 3.6.1 | 36 | 36 | 3 | 3 | 2019 | 12 | 52 | 2019 Dec | 2019-12-23 | 1 | NA | NA | NA | NA |
| 76038 | 2019-12-29 | 2.14.0 | osx | 2 | osx | 2.14.0 | 214 | 214 | 2 | 2 | 2019 | 12 | 52 | 2019 Dec | 2019-12-23 | 1 | NA | NA | NA | NA |
| 76039 | 2019-12-29 | 3.4.4 | osx | 2 | osx | 3.4.4 | 34 | 34 | 3 | 3 | 2019 | 12 | 52 | 2019 Dec | 2019-12-23 | 1 | NA | NA | NA | NA |
| 76040 | 2019-12-29 | 3.4.2 | osx | 2 | osx | 3.4.2 | 34 | 34 | 3 | 3 | 2019 | 12 | 52 | 2019 Dec | 2019-12-23 | 1 | NA | NA | NA | NA |
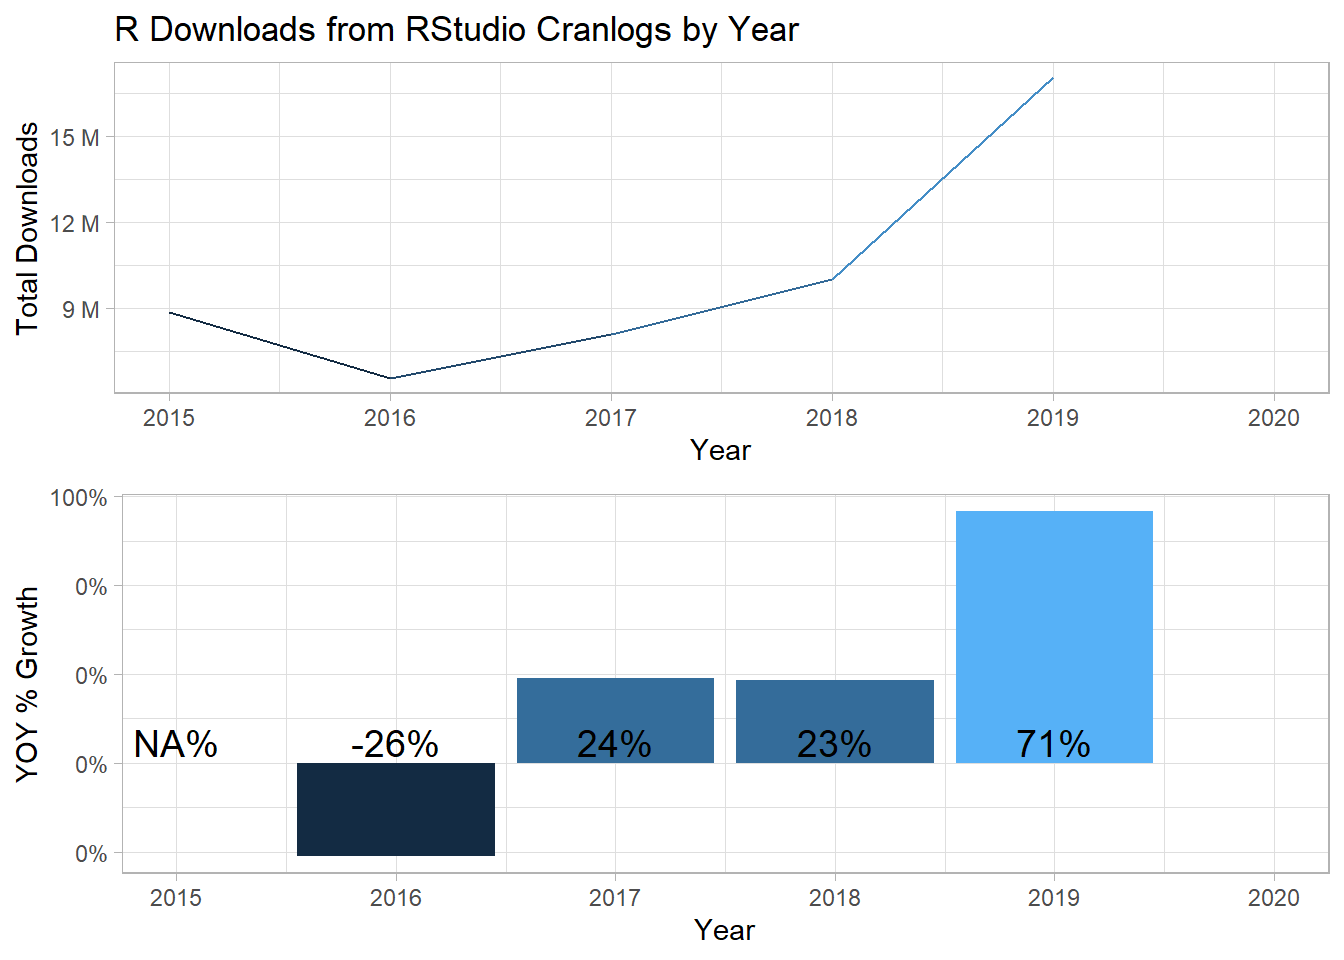
Yearly Trend
At first, I was curious about the overall trend of the data. You can see that R downloads growth is -26% from 2015 to 2016, recovering in 2017 by 24%, but about 1 million downloads short from its 2015 level. Then in 2018 R downloads grow by 2 million downloads, or by 23%, to 10 million and surpasses its 2015 level by 1 million downloads. Finally, R downloads have grown by more than 71% to 17 million downloads in 2019. I have to admit those totals are more than I would have thought. This growth might explain why the Michigan CRAN mirror has added a second CRAN mirror; the Michigan CRAN mirror being the closet to my location. In any case, this evidence contradicts the suggestion that Python is having a negative impact on the adoption of R.
At this point, I could probably be done because I think that there is sufficient evidence to support that the growth in R is not being negatively impacted by the growth in Python. On the contrary, R is having its most robust year in the last 5 years. But there are some other interesting variables in the data that I would like to explore.
Natural Experiments: Tale of 2 Bends
1. Tidyverse’s Positive Impact
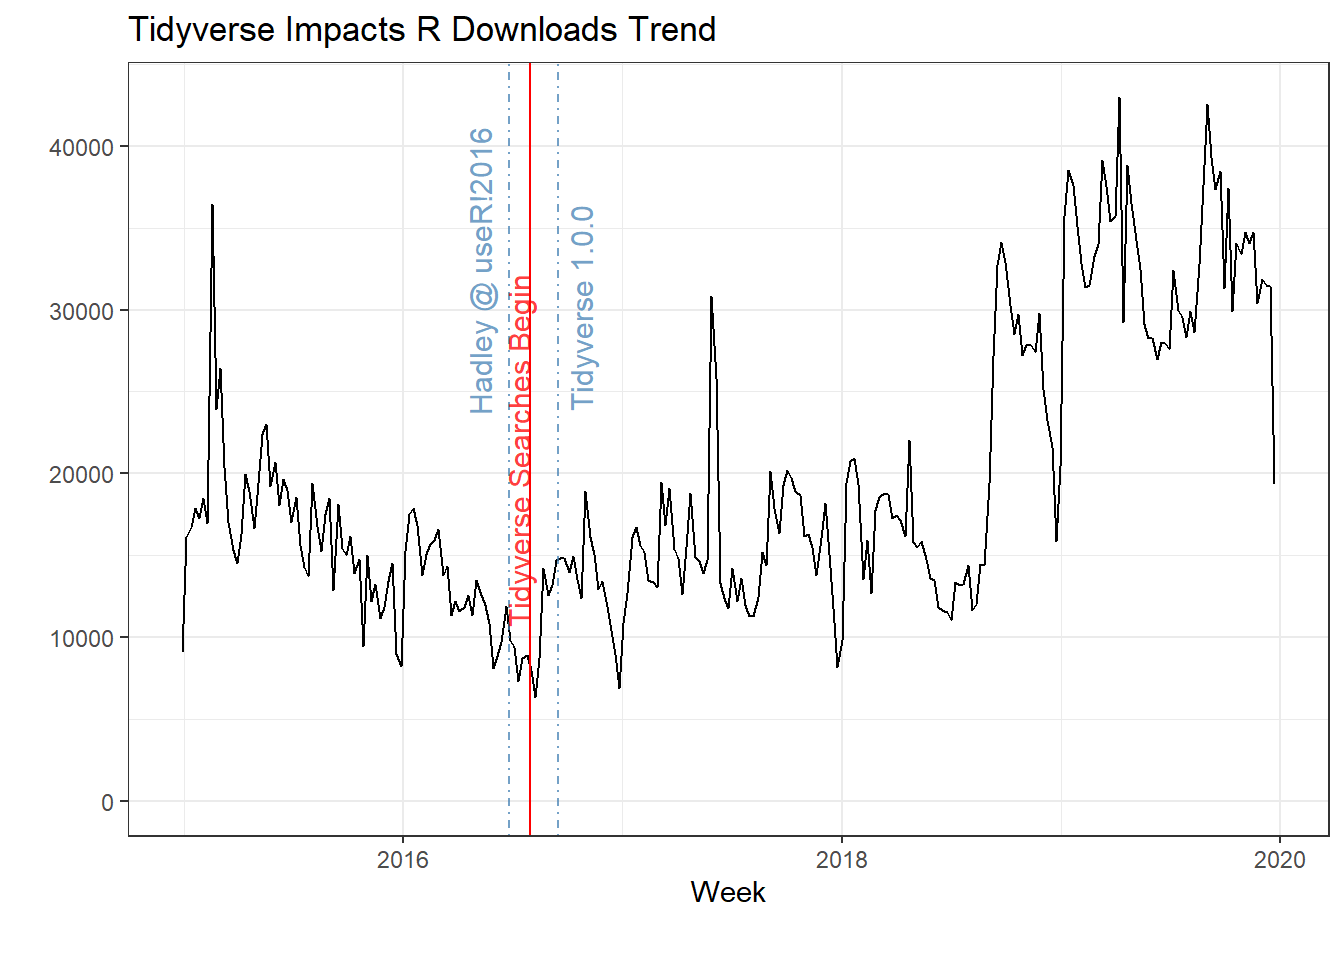
From the yearly trend above there are 2 interesting behaviors. First, is the year over year decline in 2016 and the recovery in 2017. If you look at the graph below you will notice that R downloads are in decline all of 2015 and bottom out in the middle of 2016. I wondered what happened in 2016 that broke the downward trend. As I thought about 2016, I remembered that I attended the useR! 2016 Conference at Stanford University that summer. At the conference Hadley Wickham officially announced idea of the Tidyverse, ending all references to the term Hadleyverse, which was the name that had been circling to describe the Tidyverse ecosystem at the time. We all laughed as we watched Hadleyverse catch fire on screen because it conveyed how humble Hadley truly is. His speech was given on Wednesday June 29th, 2016 (see below week of June 26th). The week of July 31st, 2016 is when the term “tidyverse” starts to appear in searches on Google Trends (data from gtrend package), or 35 days after Hadley’s speech, and Tidyverse 1.0.0 is released on September 15, 2016, or 81 days after Hadley’s speech. In the section below on Google Trends you will see correlation between the Tidyverse search term on Google Trends and R downloads bottoming out and rebounding.
Because economist are not allowed to conduct large scale social experiments with people for moral reasons, we take advantage of natural experiments. A natural experiment is when there is a policy change or natural event that has a large impact on society. We can use this event to explain and measure the impact of these large events. The logic for natural experiments comes from statistics. In statistics there is this idea that the probability of 2 independents events corresponding together is nearly zero. In other words, if there is a policy change (treatment) and a corresponding change in an outcome, the probability that these 2 things occur together would be nearly zero if it were to happen by chance. Although I have no way to prove this, but from the data below I would make the argument that the introduction of the Tidyverse paradigm (treatment) has had a positive impact on R downloads (outcome). In other words, from the point that the Tidyverse was officially introduced, R downloads have increased year over year for the last 3 years by large margins. From my experience, dplyr really made R familiar, approachable, and easy to pick up. Base R was much harder to pick up by comparison. What this shows is that the Tidyverse reduces barriers to entry for new R users by making R easier to learn and use. Put differently, Tidyverse reduces the cost of learning R and thereby increases the return on investment for each minute spent on learning R. Furthermore, the cost of using R will continue to decrease as other packages also adopt the ideas and concepts of tidy data. One example is the tsibble package and its tidy time series ecosystem, which is becoming one of my new favorites. By adopting tidy principles, this package has made manipulating time series data much easier than using the zoo or the xts package.
2. R 3.5.1 Release Marks Turning Point
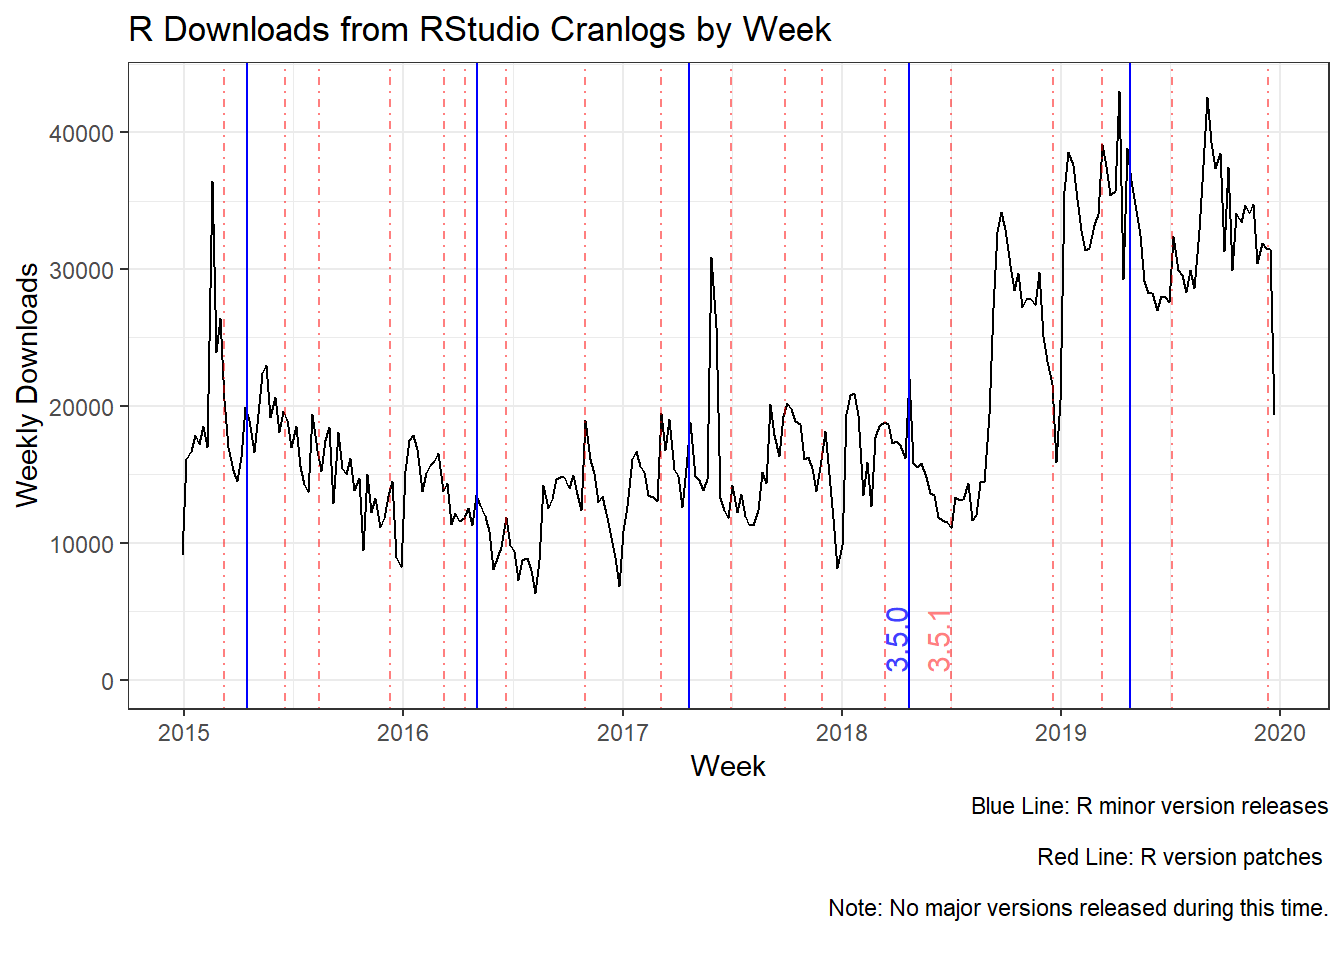
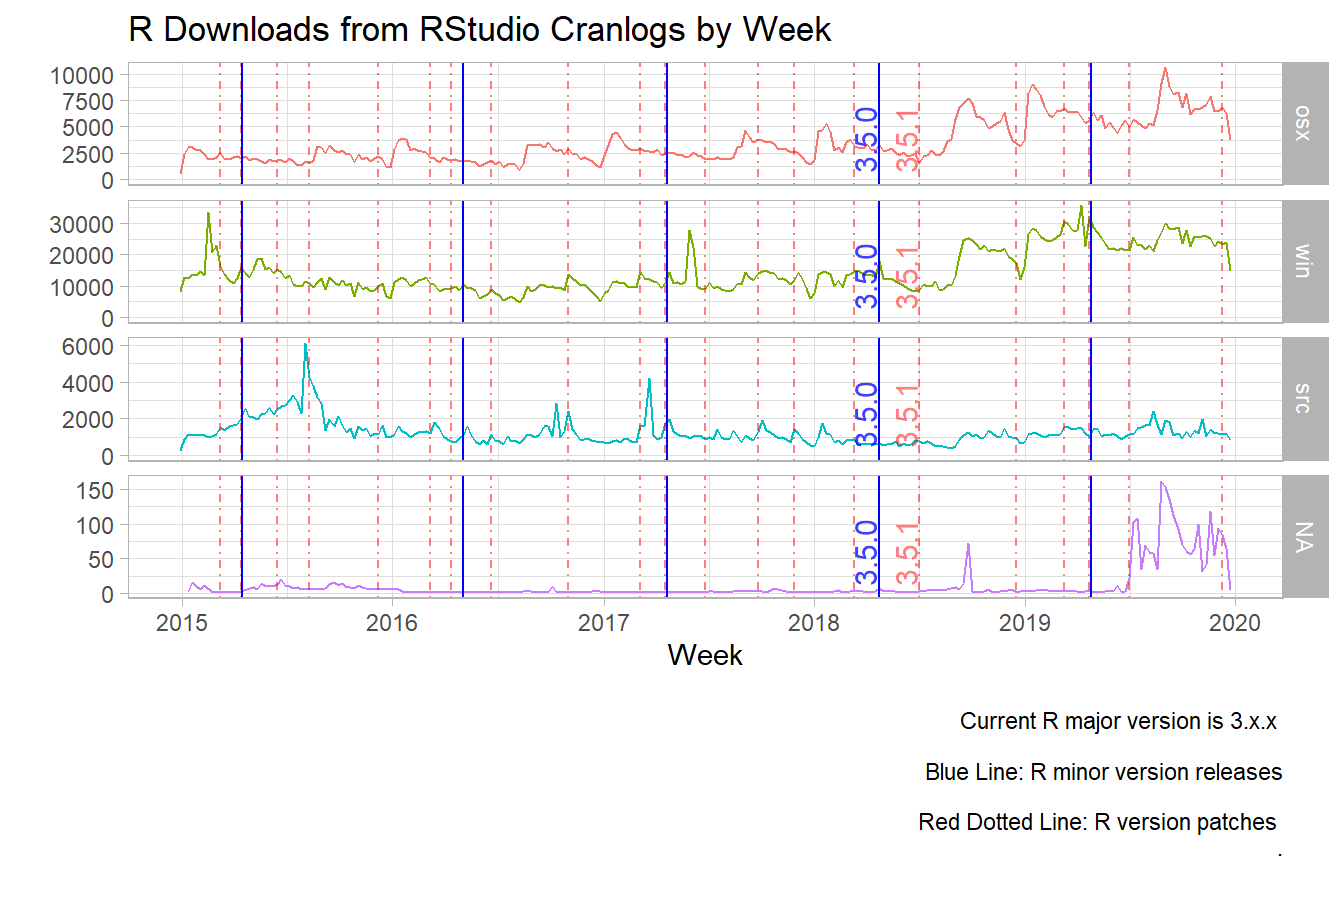
The second event is the large increase in year over year growth in the second half of 2018 and all of 2019. I could not think of any really good natural experiment to explain the large increase in R downloads in the second half of 2018. So I decided to overlay the release dates of the different versions of R; the blue line represents the minor version releases, and the red dotted line represents patch releases. There were no major releases during this time. You can see from the graph below that the release of R 3.5.1 marks the beginning of a change in the slope of R downloads at the beginning of 2018 from a slightly increasing trend to a highly increasing trend. Now why would this be?
The R 3.5.0 release was a really big release with many upgrades to the internal components of R, with some changes that made R work faster. But why no increase in downloads at this point? Well because the new R upgrades had issues with packages built on the older versions of R. Thus, a lot of your packages broke or wouldn’t even download. But a lot of these issues were resolved by the R 3.5.1 release. So this explains why we see a drop in R downloads after the R 3.5.0 release and an increase with the R 3.5.1 release. But, why would such a release convince potential users, such as data scientists, data analysts and business analysts, to adopt R? Can you image MS Excel business analysts sitting around waiting for the R 3.5.1 release and jumping up in excitement…I cannot. This natural experiment is harder to justify than the announcement of the Tidyverse because the Tidyverse changed the way users learned and use R. What I can say is the release of the R 3.5.1 correspond with something that I cannot currently measure, an omitted variable, and it marks the beginning of a large adoption in the R programming language. Or maybe I am greatly underestimating the value of faster code.
Weekly View by Operating System (OS)
1. Windows Leads the way, Mac Grows Rapidly
Now that we have established that the R 3.5.1 is an inflection point, lets see what is behind the growth in downloads. From the graphs below, we observe that the operating system (OS) with the most downloads/week is Windows, with an average of 11788 downloads/week before the release of R 3.5.1., and 22657 downloads/week post the R 3.5.1 release. I was pleasantly surprised to see that Windows was the leading OS for downloads. Most software engineers that I know use Macs for their development, so who are all these windows users? My guess, and I have no evidence to support this, is that analyst on the business side that traditionally have used excel for their work are now picking up R for the day to day analysis. R has a bad rap for having an uphill learning curve, but I believe with the Tidyverse ecosystem, this is no longer the case and anyone who says differently hasn’t used R in the last 3 to 5 years. In other words, they are speaking from inexperience with the recent improvements in the R ecosystem. I have easily brought people up to speed at work with just 2 packages, dplyr and ggplot2. Basically, anything that they can do in excel, now they can do with R, and much much more.
My second surprise from looking at the OS break out was the large increase in Mac users. I am not sure why this would be the case except that Macs are now more common at work. For a long time it was very difficult to request a Mac at work, but over the last 3 years or so, it has been much easier to obtain a Mac if you so desire. If this is happening across industries, then this may explain some of this growth in addition to the university effect where Macs seem to be quite common. R downloads for Mac averaged 2506 in the period before the R 3.5.1 release and has averaged 5782, more than doubling its weekly average downloads. The upward trend for Mac R downloads doesn’t seem to be waning so there may be more growth to come over the next year.
Finally, I will not discuss the OS labeled “NA” as it is really small; I just present it for completeness. I was not able to determine if the OS for “SRC” was building R from source, or whether it was for Linux. In any case, R downloads for “SRC” have been consistent throughout the entire time frame with some large growth after the R 3.6.1 release. The average download for “SRC” is 1373 in the period before R 3.5.1 release and 1167 after, although this is quite misleading as you have a two contrasting periods, one with low R download volume and one with much higher download volume during the post R 3.5.1 release.
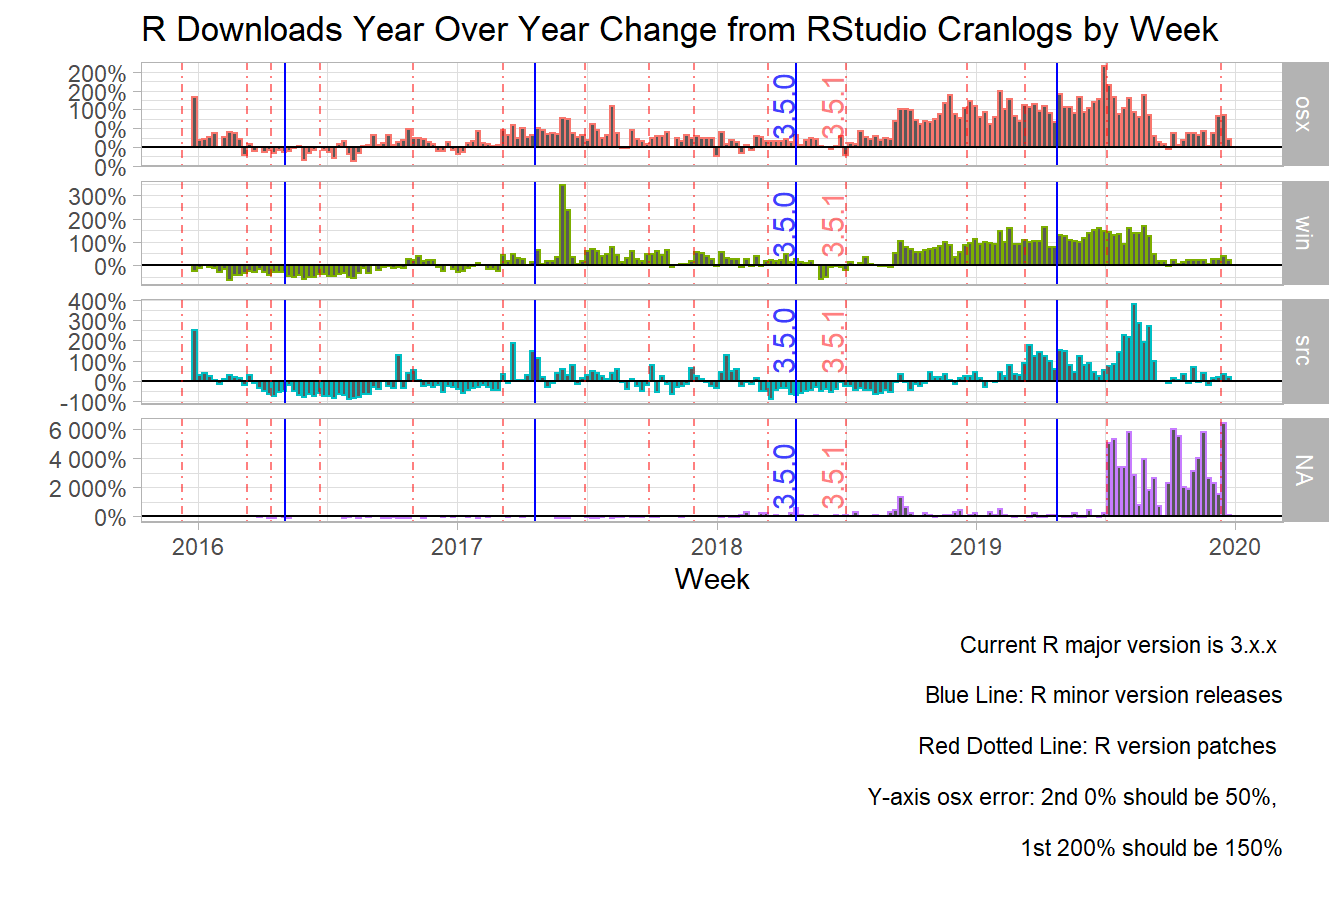
2. Skyrocketing Year Over Year Growth
In this section, I will quickly describe the year over year (YOY) growth in R downloads for each type of operating system comparing the time before the R 3.5.1 release and the time after. The average weekly YOY growth rate for Windows for the pre-period is 14% and 77% for the post period. The average weekly YOY growth rate for Mac for the pre-period is 20% and 79% for the post period. The average weekly YOY growth rate for “SRC” for the pre-period is -3% and 55% for the post period. Imagine for a second you are a product manager, and your product was experiencing nearly 80% YOY growth on average every week for nearly 2 years; how ecstatic would you be? That kind of growth for any product is pretty remarkable.
The Problem with Using Search Trends
Let’s get back to the subject at hand. The problem using search trends to make predictions is that it makes large assumptions that your consumer remains static. In other words, it ignores how consumers have learned and adapted to new technology. For example, a few years ago the R programming language was new to the masses, meaning analysts not in tech, nor statisticians, nor data scientist. At this point most curious analyst would search terms such as “R Programming Language” on Google. But as time passes, the knowledge base is spread by word of mouth and experience. Those early innovators will spread the word but they won’t waste their coworkers time by saying google “R Programming Language.” Instead they would suggest searches such as “dplyr” or “ggplot2” or “DataCamp” based on their experience. From my experience, I cannot remember the last time I searched for the “R Programming Language;” its been years. But I search for R topics every single day. My searches normally look like this: “r package function” or “r function error.” So when I am teaching R to my coworkers this is the format that I use; never do I say search for “R Programming Language.”
For example, the TIOBE Index uses +“<language> programming” for its search query and then counts the hits generated from dozens of search engines, and finally applies a standardization method (see references below). So for R the search would be “R programming.”
The PLPY Index is a little better, but not much better. They use the term “<language> tutorial” to build their index. I like this better because it suggest that potential users/analysts are interested in courses where they can learn R, discovering potential new users. It tries to get at the way potential R users would go about learning R; it gets at consumer behavior. However, this search term is quickly undermined by the current R users. For example, I always recommend DataCamp for learning R, or even Python. So now my coworkers no longer search for “tutorials” they are now searching for “DataCamp.” There are many other websites that provide training, so once you have found what you are looking for, you don’t ever search for “R tutorials” even though you are continue to learn R.
Whatever methods they use are irrelevant; the problem is that the search terms don’t accurately reflect the changes in behavior and maturity of the consumer over time.
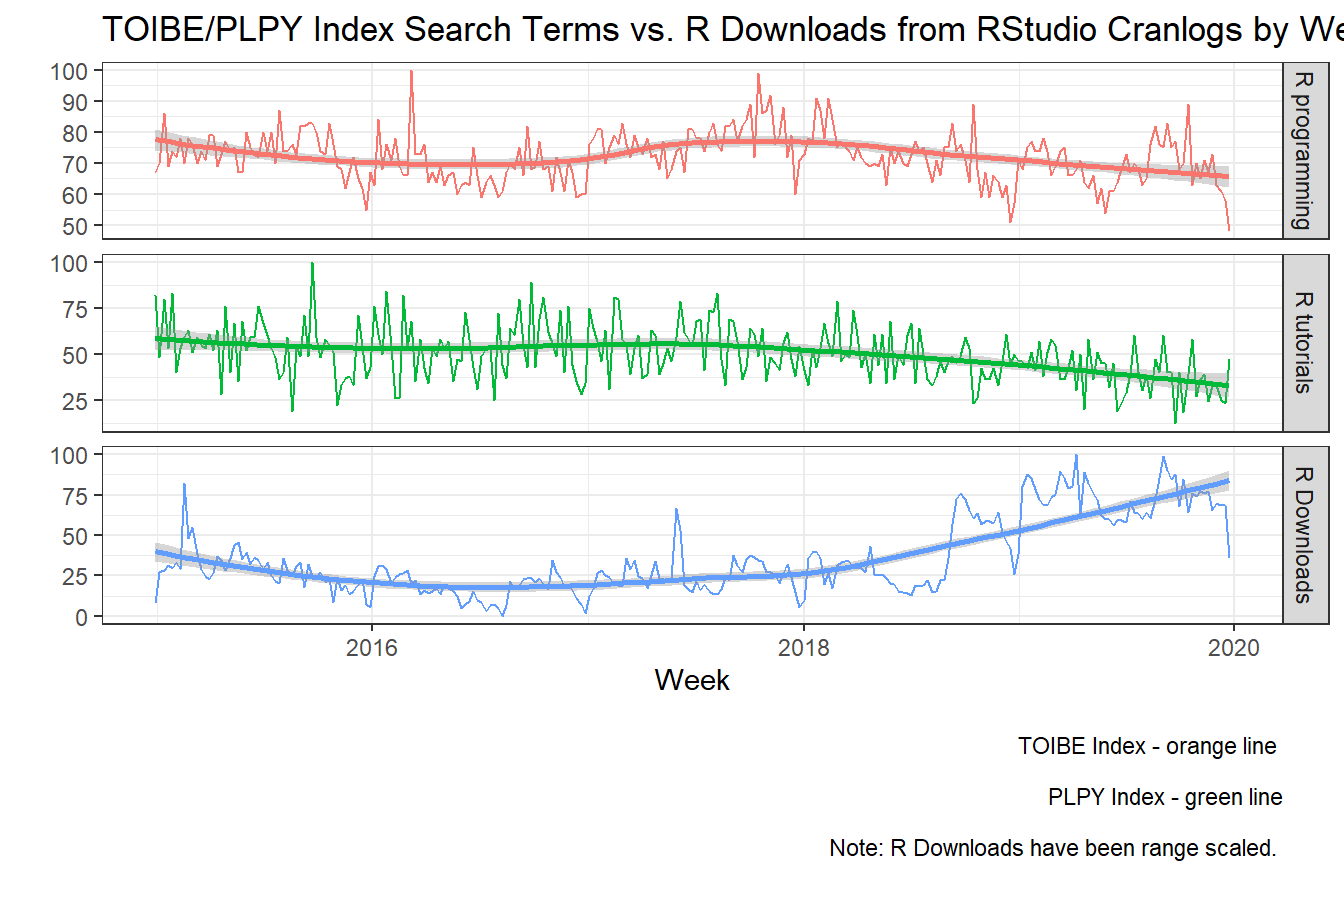
Where Popular Search Trends Indexes Fail at Prediction
In the graph below I will show why such “search trend” based predictions are risky for forecasters. Both the TOIBE Index (“R programming”) and the PLPY Index (“R tutorials”) show interest for R peaking 2017 and steadily declining over time. So If you believe that correlation = causation, then you would conclude that the interest for R has been in decline, and R is on the way out. This would explain the blog posts over that last year or so claiming that R was doomed. Second, they go even further and extrapolate that the cause is due to the adoption of Python, without any evidence. Yes, Python is on the rise and no one contradicts that, but we all know that correlation does not equal causation. As I have discussed above, and you can see below, R downloads actually have been on the rise since 2017. The data below shows that search trends are not good predictors if you don’t know where on the product life cycle your consumer/user is currently in.
Even Targeted/Informed Search Trends fail at Prediction
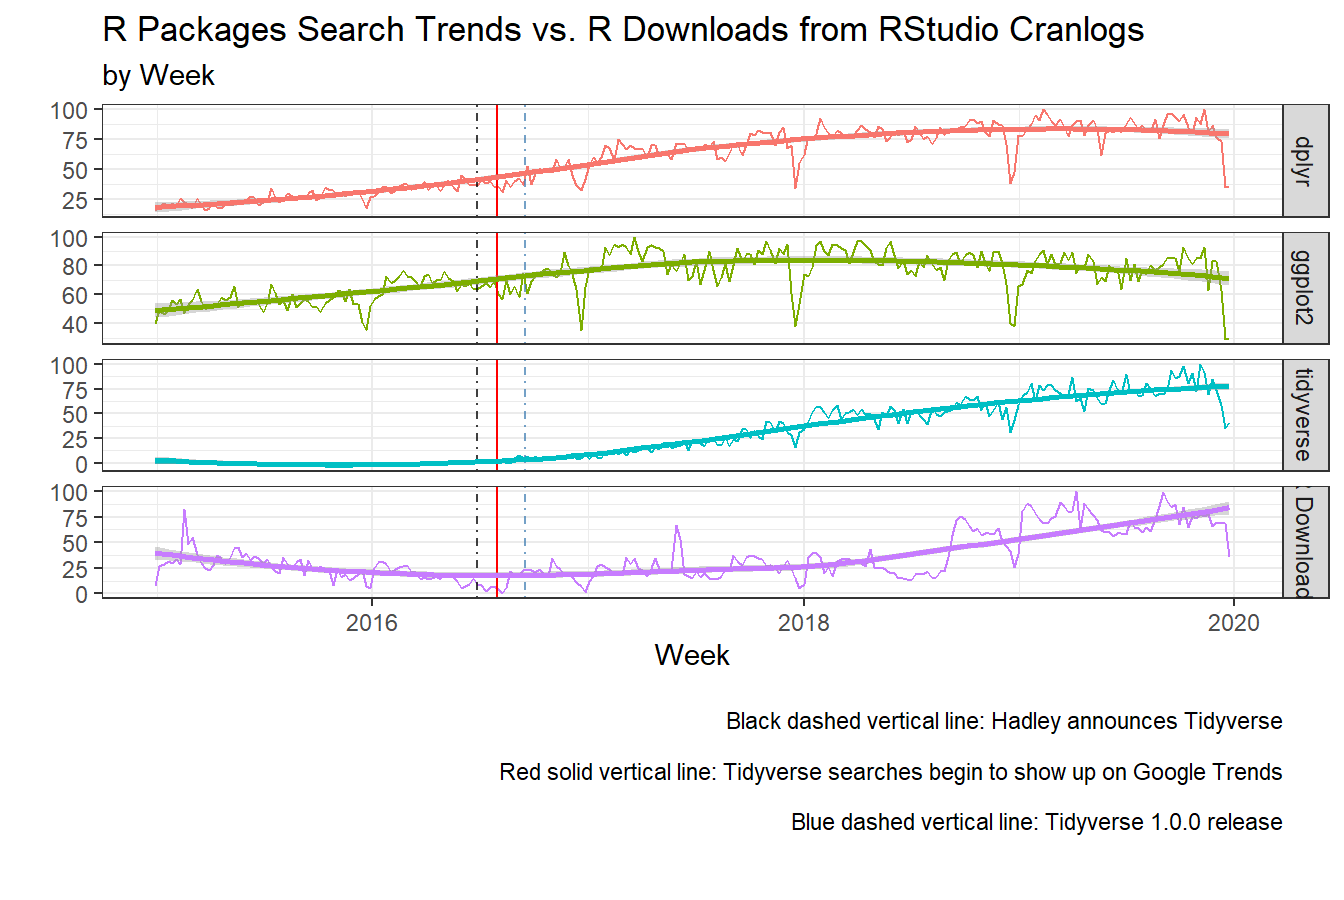
Let’s discuss a situation where you might know your R consumer/user. As an R user I know that the main packages for data munging in R are Tidyverse, and data.table for data in the hundreds of millions of rows. I will focus on Tidyverse since I have discussed this in post above. As an R user I know that I use dplyr and ggplot2 as my core packages from the Tidyverse ecosystem for data manipulation and visualization. So I do a lot of daily searching on “r dplyr function,” or “r ggplot2 visualization” for example. So I downloaded their search trends along with Tidyverse because Tidyverse now includes both dplyr and ggplot2 among a few other packages. I also include the dates for the Tidyverse 1.0.0 release and announcement in the graph below.
The first thing to notice is dplyr and ggplot2 are increasing early on because these packages where around before the Tidyverse package and Tidyverse ecosystem of packages. My original thought was dplyr and ggplot2 would predict R downloads, but as you can see that they do not trend very well with R downloads. What I conclude is that dplyr and ggplot2 were very popular with current users but those 2 packages alone were not enough to get new users to jump on board with R. Remember that before Hadley’s announcement ( black dashed line) there was no cohesive ecosystem of packages for data analysis in R.
Second, we continue to see the importance of Hadley’s annoucement of the Tidyverse ecosystem. As discussed above, it takes 35 days for searches to appear in Google Trends after Hadley’s Tidyverse announcement, which means that the daily search trends reaches at least 5000 hits per day (red vertical line). The week where “tidyverse” hits begin is the week that R downloads bottom out, the bottom of the parabola on the smooth purple line. The next week you see a jump in R downloads (purple line). From that point on R downloads have been increasing. As I argued above, Tidyverse has changed the attractiveness of R for new R users, but from evidence I see below, I would not use “tidyverse” search trends to predict the R downloads because even though both are increasing, they don’t really trend very closely until 2018 and after. But even then I would be skeptical that the relationship would hold for long as consumer behavior evolves and they begin to look for specific features within the Tidyverse, such as the purrr package, to solve less generalizable problems.
This shows that even when you are being more mindful about your consumers behavior and search patterns, you may still be at risk when making generalizing predictions.
Conclusions
What are the take aways from this analysis? First, R downloads have been increasing for the last several years, clearly conveying that more users are adopting R to conduct their data analysis and data science work. In addition, it also provides evidence that the growth in Python has had no impact on the adoption of R. Second, Windows dominates R downloads by large margins, and both Windows and Macs are driving the growth after the R 3.5.1 version release. Third, a simple idea that data should be tidy can lower barriers to entry for non-software users, and unify a community to be highly thoughtful, cohesive, and innovative when building packages. Finally, using search trends for prediction lacks rigor. This example shows that even when trends are moving in the same direction, it is questionable as to whether they can be used for predictions. Forecasting data has a relatively high bar; the data needs to be consistently accurate at predicting over time. Having a model that does well this month and not next month is evidence of overfitting and lacks any real theory about what is truely happening in the data generating process. In other words, you got lucky.
Further research opportunities:
One concern that I have about using RStudio CRAN mirror for this analysis is that the increase in R downloads is due to the popularity of the RStudio IDE and not of R. Since RStudio is mostly used for R, I believe that this analysis still holds; it would only fail if millions of current users instead of new users were migrating from a different IDE and using RStudio for their R downloads, where before they just went to r-project.org to download R. It would be nice to be able to control for RStudio downloads, but I don’t have that data.
In closing I want to say that this post does not in any way down play Python. What it does show is that their should be more thought put into articles that make large claims about anything, especially when using web search terms for explanatory variables. Please do not make life altering decisions based on web search indexes such as the TOIBE Index or PLPY Index; do your research and use common sense. Like they used to say in the early 2000’s, don’t believe everything you read on the internet. I hope you enjoyed this post.
Reference
Cranlogs:
Hadley Announces Tidyverse at useR! 2016 conference week of 2016-06-26: https://user2016.r-project.org//
Tidyverse released 1.0.0 on 2016-09-15: https://blog.rstudio.com/2016/09/15/tidyverse-1-0-0/
Tidy Data: https://vita.had.co.nz/papers/tidy-data.pdf
Google Trend Results: https://trends.google.com/trends/explore?date=2010-01-01%202019-11-23&geo=US&q=%22R%20programming%22,Tidyverse,dplyr,ggplot2
TIOBE Index Definition: https://www.tiobe.com/tiobe-index/programming-languages-definition/
PYPL Index Definition: http://pypl.github.io/PYPL.html?country=US
Kudos for the R image goes to:
The R logo is © 2016 The R Foundation. https://www.r-project.org/logo/
Session Info
print(sessionInfo())## R version 3.6.1 (2019-07-05)
## Platform: x86_64-w64-mingw32/x64 (64-bit)
## Running under: Windows 10 x64 (build 17763)
##
## Matrix products: default
##
## locale:
## [1] LC_COLLATE=English_United States.1252
## [2] LC_CTYPE=English_United States.1252
## [3] LC_MONETARY=English_United States.1252
## [4] LC_NUMERIC=C
## [5] LC_TIME=English_United States.1252
##
## attached base packages:
## [1] stats graphics grDevices utils datasets methods base
##
## other attached packages:
## [1] plotly_4.9.1 kableExtra_1.1.0 scales_1.0.0 rversions_2.0.0
## [5] gtrendsR_1.4.4 tsibble_0.8.4 forcats_0.4.0 stringr_1.4.0
## [9] dplyr_0.8.3 purrr_0.3.2 readr_1.3.1 tidyr_1.0.0
## [13] tibble_2.1.3 ggplot2_3.2.1 tidyverse_1.2.1 gridExtra_2.3
## [17] lubridate_1.7.4 cranlogs_2.1.1
##
## loaded via a namespace (and not attached):
## [1] Rcpp_1.0.1 lattice_0.20-38 utf8_1.1.4
## [4] assertthat_0.2.1 zeallot_0.1.0 digest_0.6.21
## [7] plyr_1.8.4 R6_2.4.0 cellranger_1.1.0
## [10] backports_1.1.5 evaluate_0.14 httr_1.4.1
## [13] highr_0.8 blogdown_0.16 pillar_1.4.2
## [16] rlang_0.4.0 lazyeval_0.2.2 curl_4.2
## [19] readxl_1.3.1 rstudioapi_0.10 data.table_1.12.4
## [22] rmarkdown_1.16 labeling_0.3 webshot_0.5.2
## [25] htmlwidgets_1.5.1 munsell_0.5.0 broom_0.5.2
## [28] anytime_0.3.6 compiler_3.6.1 modelr_0.1.5
## [31] xfun_0.10 pkgconfig_2.0.3 htmltools_0.4.0
## [34] tidyselect_0.2.5 bookdown_0.14 fansi_0.4.0
## [37] viridisLite_0.3.0 crayon_1.3.4 withr_2.1.2
## [40] grid_3.6.1 nlme_3.1-141 jsonlite_1.6
## [43] gtable_0.3.0 lifecycle_0.1.0 magrittr_1.5
## [46] cli_1.1.0 stringi_1.4.3 reshape2_1.4.3
## [49] xml2_1.2.2 ellipsis_0.3.0 generics_0.0.2
## [52] vctrs_0.2.0 tools_3.6.1 glue_1.3.1
## [55] hms_0.5.1 yaml_2.2.0 colorspace_1.4-1
## [58] rvest_0.3.4 knitr_1.25 haven_2.1.1